


Schedule a Chat
Contact Info
Suite 17.03, Level 17
20 Bond Street
Sydney NSW 2000

INSIGHTS WITH EVALESCO
TOPICS DISCUSSED
A key driver of market behaviour in the year-to-date has been the persistence of inflation and the resultant rate hikes from central banks around the globe. Whilst headline inflation has reduced across several regions, core inflation measures remain above target inflation rates for central banks. This necessitated the decision by several central banks during the June quarter to continue raising rates. The real economy continues to slow with investors looking forward to the peak in this rate hiking cycle. Equity investors have taken the rate rises in their stride, pushing headline equity markets higher through the June quarter.
Economic momentum slowed in China through the second quarter, with weaker data across industrial output, retail sales, private fixed-asset investment, and property investment. The People’s Bank of China (PBOC) reduced the 7-day reverse repo rate in June by 10 basis points to 1.90%, which is their main cash rate. This was the third reduction during the current phase of economic easing, indicating some concern about China’s economic recovery.
|
An error that led to a recession would be regarded as a smaller error than one which led to a second period of entrenched peace-time inflation – Former RBA Governor, Ian Macfarlane |
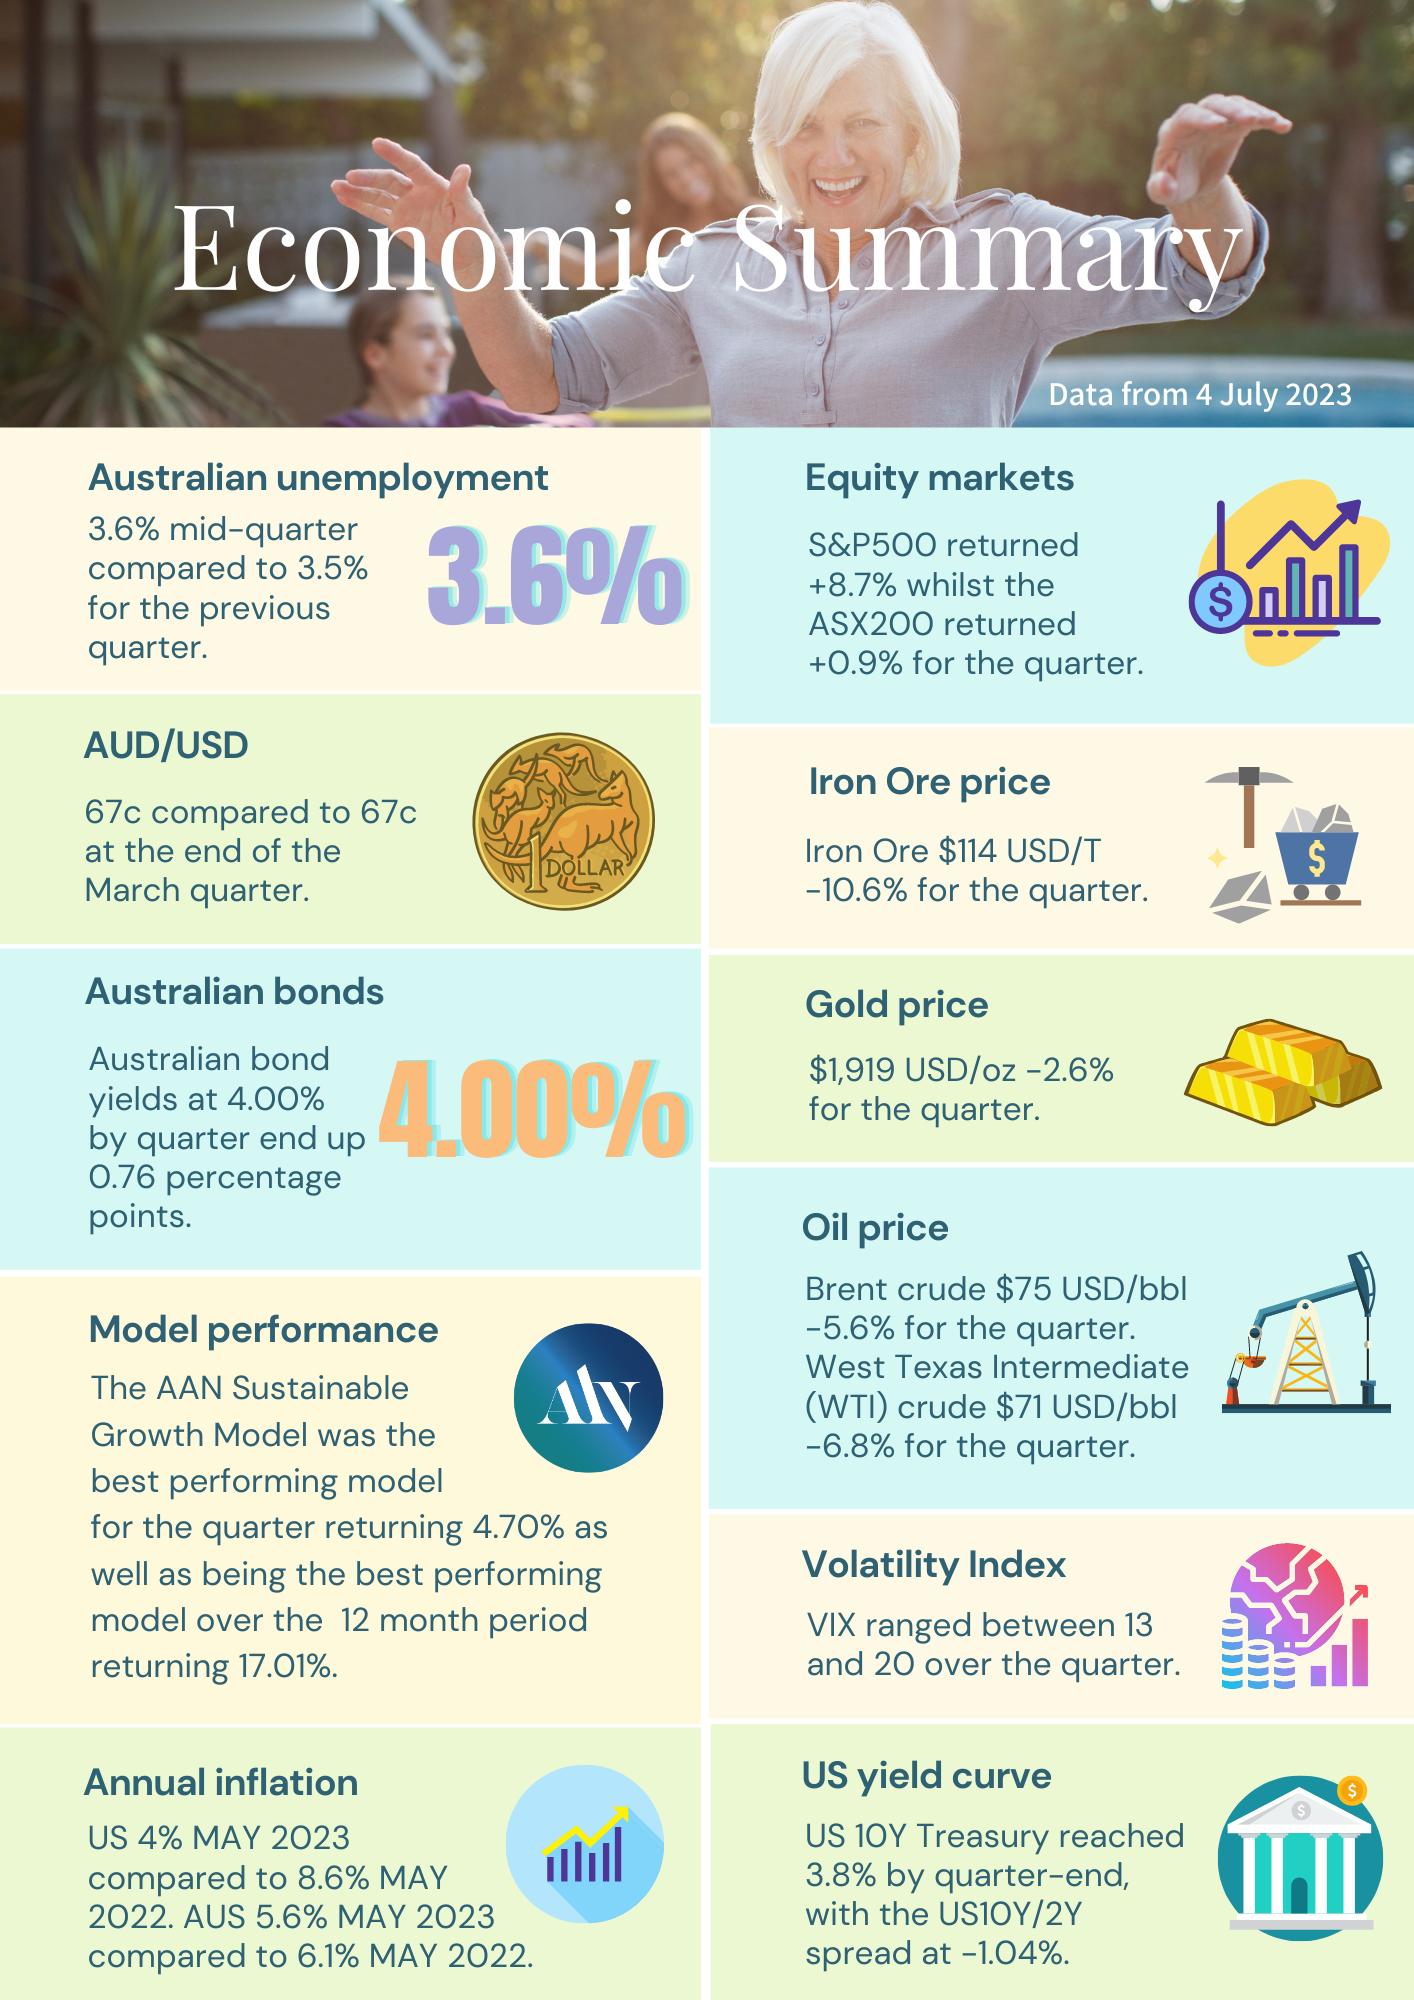
The Reserve Bank of Australia (RBA) surprised markets with a second consecutive hike to the cash rate in early June. After a pause at the April meeting, the RBA increased rates in May and June by 0.25% each to reach 4.1%. These decisions were supported by inflation data which showed a 7% increase in headline inflation in the year to 31 March, which was above consensus expectations. However, towards the end of June the Australian monthly inflation number was down to 5.6% for the 12-month period, which caused the market to pare back expectations of more hikes. The RBA meeting on July 4th resulted in a pause, keeping the cash rate at 4.1%, but with a tightening bias.
The 10-year Australian government bond yield pushed higher to more than 4% in mid-June following the RBA hikes and release of inflation data, after being as low as 3.2% earlier in the quarter. The bond yield had been tracking below the equivalent US 10-year Treasury for extended periods since early February, part of which was due to the RBA’s more dovish approach compared to the US Federal Reserve (Fed) for much of this year, but also due to the Fed’s pause on their cash rate in June (see further below). The higher RBA cash rate put upward pressure on the AUD, quickly appreciating by almost 4c to reach 69c against the USD in the days following the RBA’s June hike.
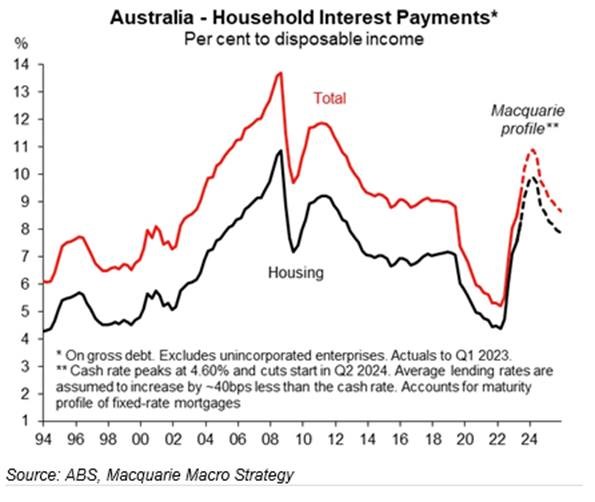
Australian households are progressively feeling the stress from these rate rises on their finances. As the graph from Macquarie shows, the percentage of a household’s disposable income being spent on total interest (red line) has risen from around 5% at the start of 2022 to over 9% by the end of March 2023. The largest part of these interest payments is derived from housing interest payments (black line), which have risen from around 4% to 8% of disposable income.
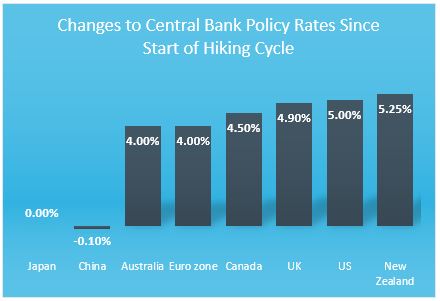
Across the Tasman, the Reserve Bank of New Zealand (RBNZ) hiked twice over the quarter, by 0.50% in April, then a ‘dovish’ 0.25% hike in May, to reach 5.5%. Market participants are still undecided on what’s next for the official cash rate, with some forecasting further hikes, whilst some others believe the RBNZ has done enough. The New Zealand economy entered a technical recession, with a -0.1% contraction in GDP growth for the March quarter, following -0.7% for the December 2022 quarter. The economy is on a soft footing, with current account data also released over the quarter, revealing a deficit of 8.5% against GDP. This was a slight mark down from the Q4 2022 print of 9%, which was the largest deficit since the mid-80s.
Like the RBA, the Bank of Canada (BoC) also surprised markets, increasing the key cash rate by 0.25% to reach 4.75% in June. The BoC had paused at the previous two monetary policy meetings in March and April. Headline inflation increased to 4.4% which was the first increase in ten months. Both goods and services inflation remain persistent, with the BoC also continuing its policy of quantitative tightening, having started this in April 2022.
The Bank of Japan (BoJ) went against the grain at their June meeting compared to other central banks. The BoJ kept their key policy rate unchanged at -0.1%, whilst also keeping the 10-year government target yield at 0.0% (around ranges of 0.5%). “At present, inflation has exceeded 2% for thirteen straight months but could fall below that level ahead. That’s why we are not normalising monetary policy. But if that view changes sharply, we will have to change policy,” said Governor Kazuo Ueda. The annual inflation rate to end of May declined to 3.2% which was lower than expected.
UK inflation exceeded expectations, with both headline and core measures surpassing consensus. Core inflation hit a 31-year high, reaching 7.1%, whilst headline inflation to the end of May was 8.7% for the year. This put pressure on the Bank of England before their monetary policy meeting in late June, subsequently hiking the policy rate by 0.50% to 5.0%. The Bank of England (BoE) has now raised rates at 13 consecutive meetings.
The European Central Bank (ECB) raised rates for the 8th consecutive meeting, hiking the deposit facility rate by 0.25% to 3.5% in mid-June. This is the highest it’s been in 22 years. The ECB also stated that persistently high inflation virtually ensured another rate hike in late July. The ECB’s decision to raise interest rates follows an underestimation of the resilience of price increases in 2022. Headline inflation to the end of June was 5.5% for the year, down from 6.1%. However, core inflation gives a clearer picture of longer-term price pressures and was up from 5.3% to 5.4%.
A meeting-to-meeting approach will be taken by the ECB given uncertainty about the transmission of rate hikes through the economy. At the ECB Forum on Central Banking in Sintra, Portugal at the end of June, Christine Lagarde, President of the ECB stated: “Uncertainty about transmission arises from the fact that the euro area has not been through a sustained phase of rate hikes since the mid-2000s and has never seen rates rise so quickly. And this raises the question of how quickly and forcefully monetary policy will be transmitted to firms – via interest-sensitive spending – and households, via mortgage payments.”
Following softer headline inflation data released in mid-June, the US Federal Reserve decided to pause hiking at its June meeting, leaving the Fed Funds rate at 5.00-5.25%. However, the Fed maintained a tightening bias. Markets were anticipating the pause as the quarter progressed, with the focus subsequently moving to the Fed’s July meeting. US Treasuries moved around significantly through the quarter given uncertainty on inflation data and what the Fed would do. The 10-year Treasury traded as low as 3.3% at the beginning of the quarter before rising to over 3.8% in June. Comparatively, the 2-year Treasury traded at 4% in early April before rising to almost 4.9% in June.
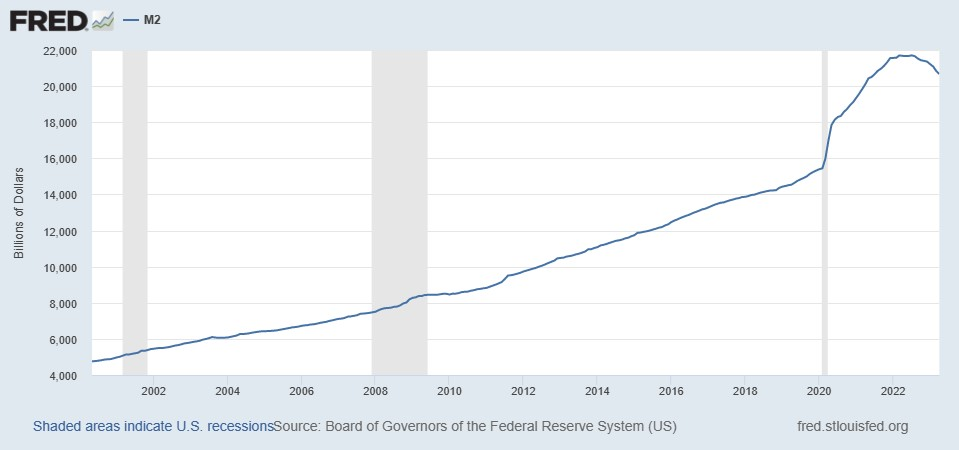
The inverted yield curve is one indicator signalling a recession in the US, but there are several other indicators indicating a recession too. These include the contraction in money supply over the past year (see the St Louis Fed graph, down by approximately USD 1 trillion from July 2022), the decrease in new orders from customers of manufacturing firms, the annual change in new private housing permits authorised, and the annual percentage decrease in average weekly hours within the manufacturing sector. Furthermore, the steep rise in the Fed rate will have a lag effect, with the tightening effects still to be felt more broadly across households and corporates.
The US debt ceiling conundrum was avoided during the quarter. President Biden enacted the Fiscal Responsibility Act of 2023 in early June, which temporarily eliminated the risk of an economic disaster caused by a failure to repay the country’s debts and established spending restrictions for a period of two years. This provided relief to markets after weeks of political back and forth between the Democrats and Republicans. Fiscal bargaining was at play despite the potentially devastating consequences of a default.
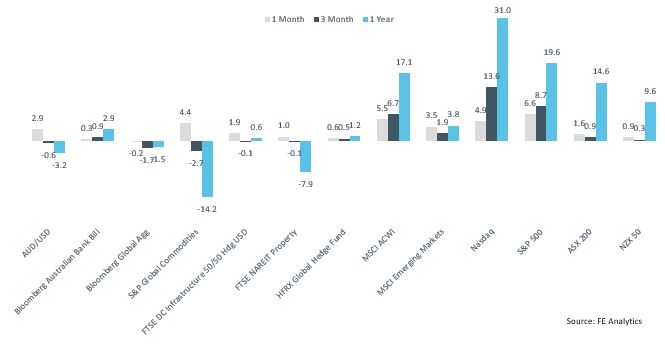
US equity market performance since the start of the year was driven by a narrow set of mega cap technology stocks. One measure that demonstrates this is the return of the standard S&P 500 index versus the equal-weighted S&P 500 index. The standard index is constructed using a market-cap weighted method, meaning the performance of the larger stocks in the index (Apple, Microsoft, Amazon, Nvidia, Alphabet) will drive more of the performance. For the first six months of the year the standard index returned almost 17%, compared to the equal-weighted index return of just over 7%. Further to this, the Nasdaq index (largely made up of technology stocks) returned over 37% for the first half of the year, its best return ever.
Towards the end of the quarter, Apple regained its title of the first $3 trillion company. After briefly hitting the mark in 2022 it has climbed back over the $3 trillion level. The next largest company, Microsoft, is roughly half a trillion dollars smaller than Apple. Part of the incredible returns in these mega cap stocks through 2023 has been the artificial intelligence thematic. This thematic has plenty of investors excited, though investors should be cognisant of how much any future growth has already been priced into stock prices.
Elsewhere in markets, a broad rise in global yields over the quarter meant global bonds were down slightly. The general sentiment during the quarter was risk-on. This is evidenced by positive returns from each of the equity indices shown in the graph above, albeit only a small positive return for the ASX 200 over the quarter.
What’s next?
So far in 2023 the dominant drivers of market movements have been high inflation and consequent central bank actions. What was apparent over the quarter regarding inflation and central banks is the divergence in data and resultant central bank actions. The future of inflation remains uncertain and differs among economies. Central banks are nearing the end of their hiking cycles, although the proximity to the peak varies among them. The more embedded inflation becomes, the harder it is for monetary policy to combat it, and the higher the risk of inflation remaining elevated above central bank targets. While investors try to determine where inflation and yields will settle in the next 6-12 months, uncertainty will reign, meaning elevated volatility across markets.
A broader trend making it harder for central banks to tame inflation stems from simmering geopolitical matters. In recent years, a trade policy rethink has been under way among many countries. The Russian invasion of Ukraine exacerbated this, putting a spotlight on Europe’s energy supplies. The trend has also emanated from the ongoing threat of China on Taiwan and the semiconductor sector. Both the US and Japan have tightened export controls to China specifically regarding technology.
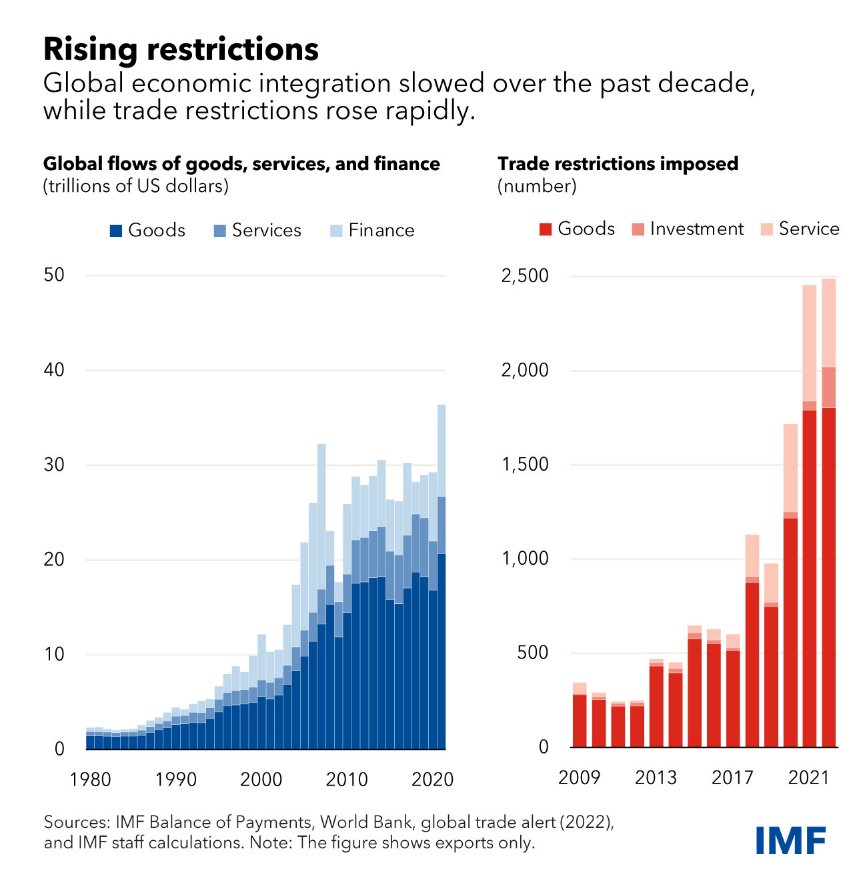
A more fragmented global economy will likely mean less efficiency, less trade diversification, higher costs, and lower productivity, making it harder for central banks to control inflation.
Research from the International Monetary Fund on geoeconomic fragmentation suggests: “Depending on modelling assumptions, the cost to global output from trade fragmentation could range from 0.2 percent (in a limited fragmentation / low-cost adjustment scenario) to up to 7 percent of GDP (in a severe fragmentation / high-cost adjustment scenario); with the addition of technological decoupling, the loss in output could reach 8 to 12 percent in some countries.”
Attention should be paid to offshore currency exposure. In risk-off environments the AUD tends to soften and thus cushion the unrealised value of any exposure to foreign assets.
With rates currently much higher it’ll provide a sturdier base for generating returns. However, where those returns come from will be less certain, and the overall market environment will become less supportive as the real economy slows. Risk management will be essential to help navigate different markets and can ultimately help achieve investment objectives.
Caution is recommended due to the ongoing risks posed by inflation to households and businesses. Tighter lending standards through 2023 are likely to remain in the near term. Ongoing pressure on corporate profits will negatively impact those companies that haven’t built resilient balance sheets.
It is crucial to regularly assess the risk of investments and diligently evaluate overall portfolios. This will be essential in navigating an extended phase of market instability in 2023.
You can download the entire Quarterly Investment Update HERE
Regards,
Marshall Brentnall, and the AAN Investment Committee
SHARE OUR INSIGHTS
Share on Facebook
Share on Email
Share on Linkedin

NEWSLETTER

Evalesco Financial Services Level 17, 20 Bond Street Sydney NSW 2000
Phone: (02) 9232 6800
The information provided on and made available through this website does not constitute financial product advice. The information is of a general nature only and does not take into account your individual objectives, financial situation or needs. It should not be used, relied upon, or treated as a substitute for specific professional advice. We recommend that you obtain your own independent professional advice before making any decision in relation to your particular requirements or circumstances. Evalesco Financial Services do not warrant the accuracy, completeness or currency of the information provided on and made available through this website. Past performance of any product discussed on this website is not indicative of future performance. Copyright © 2019 Evalesco Financial Services. All rights reserved
